Capital plans drift when requirements, cost and schedule are tracked in separate places. We tie them together, so owners and investors see what a program will cost, when it will deliver and where the risk sits.
What it coversBusiness requirements, CAPEX/OPEX optimization, TCO, forecasting, P&L support, earned value, capital planning and risk analysis.
Before capital is approved, and whenever cost or schedule starts to drift
What you leave with
A baseline, a forecast you can defend and a live risk register
How an engagement runs
From business case to steady reporting
We keep cost, schedule and risk in one view, from the first requirement to the last forecast.
Phase 01
Frame
We capture what the business needs from the program: capacity, timing, resilience and budget limits, written down and agreed before any number is modelled.
Deliverable
Business requirements brief
Phase 02
Model
We build the cost picture across capital and operating spend, compare options on total cost of ownership and show which assumptions move the answer most.
Deliverable
CAPEX, OPEX and TCO model
Phase 03
Baseline
We set the budget, schedule and capital plan the program will be measured against, with contingency sized to the real risks.
Deliverable
Program baseline and capital plan
Phase 04
Track
We measure progress with earned value, update forecasts as work is done and flag variance early, while there is still room to act.
Deliverable
Earned value and forecast report
Phase 05
Report
We turn the numbers into reporting your board, lenders and investors can read, including P&L support and a current view of risk.
Deliverable
Executive and investor report
How we work
A forecast is only useful if it is honest about what could change it.
One set of numbers
Cost, schedule and risk are tracked together, not in separate files.
Assumptions in the open
Every forecast shows what it depends on.
Early warning
Variance is raised while there is still room to act.
What we cover
Six disciplines behind a dependable forecast.
We run each one on the owner’s side and keep the results in a single, current picture.
Capacity, resilience, timing and budget needs translated into measurable program requirements.
02
CAPEX and OPEX optimization
Options compared on capital and operating cost, so savings in one are not paid for in the other.
03
Total cost of ownership
Lifecycle cost models covering build, energy, maintenance and refresh across the life of the facility.
04
Forecasting and P&L support
Cash flow and cost-to-complete forecasts, with the inputs your finance team needs for the P&L.
05
Earned value and capital planning
Progress measured against spend, and a capital plan that phases funding to match delivery.
06
Risk analysis
A quantified risk register with owners, mitigations and contingency tied to each exposure.
Proof in practice
Featured project
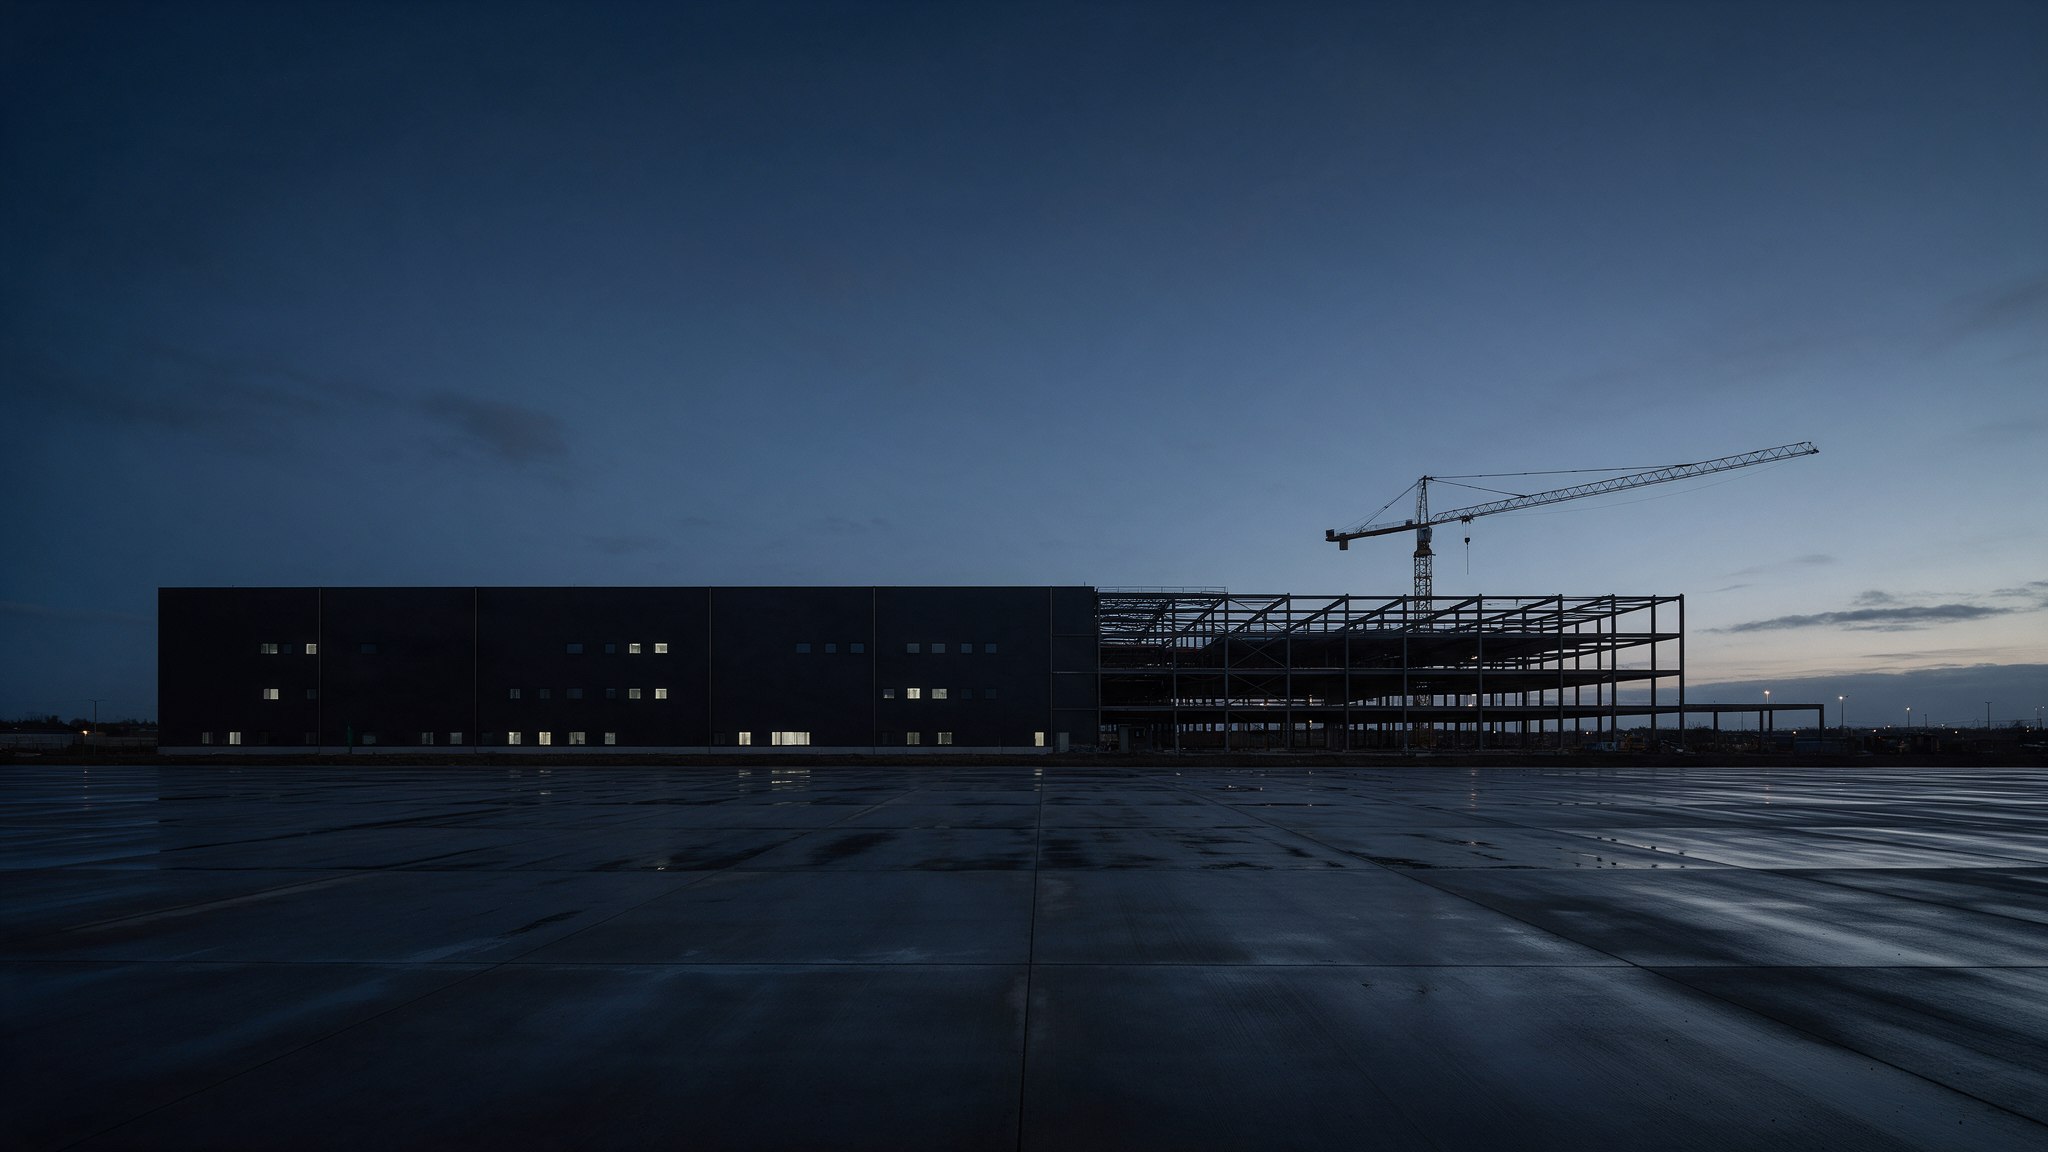
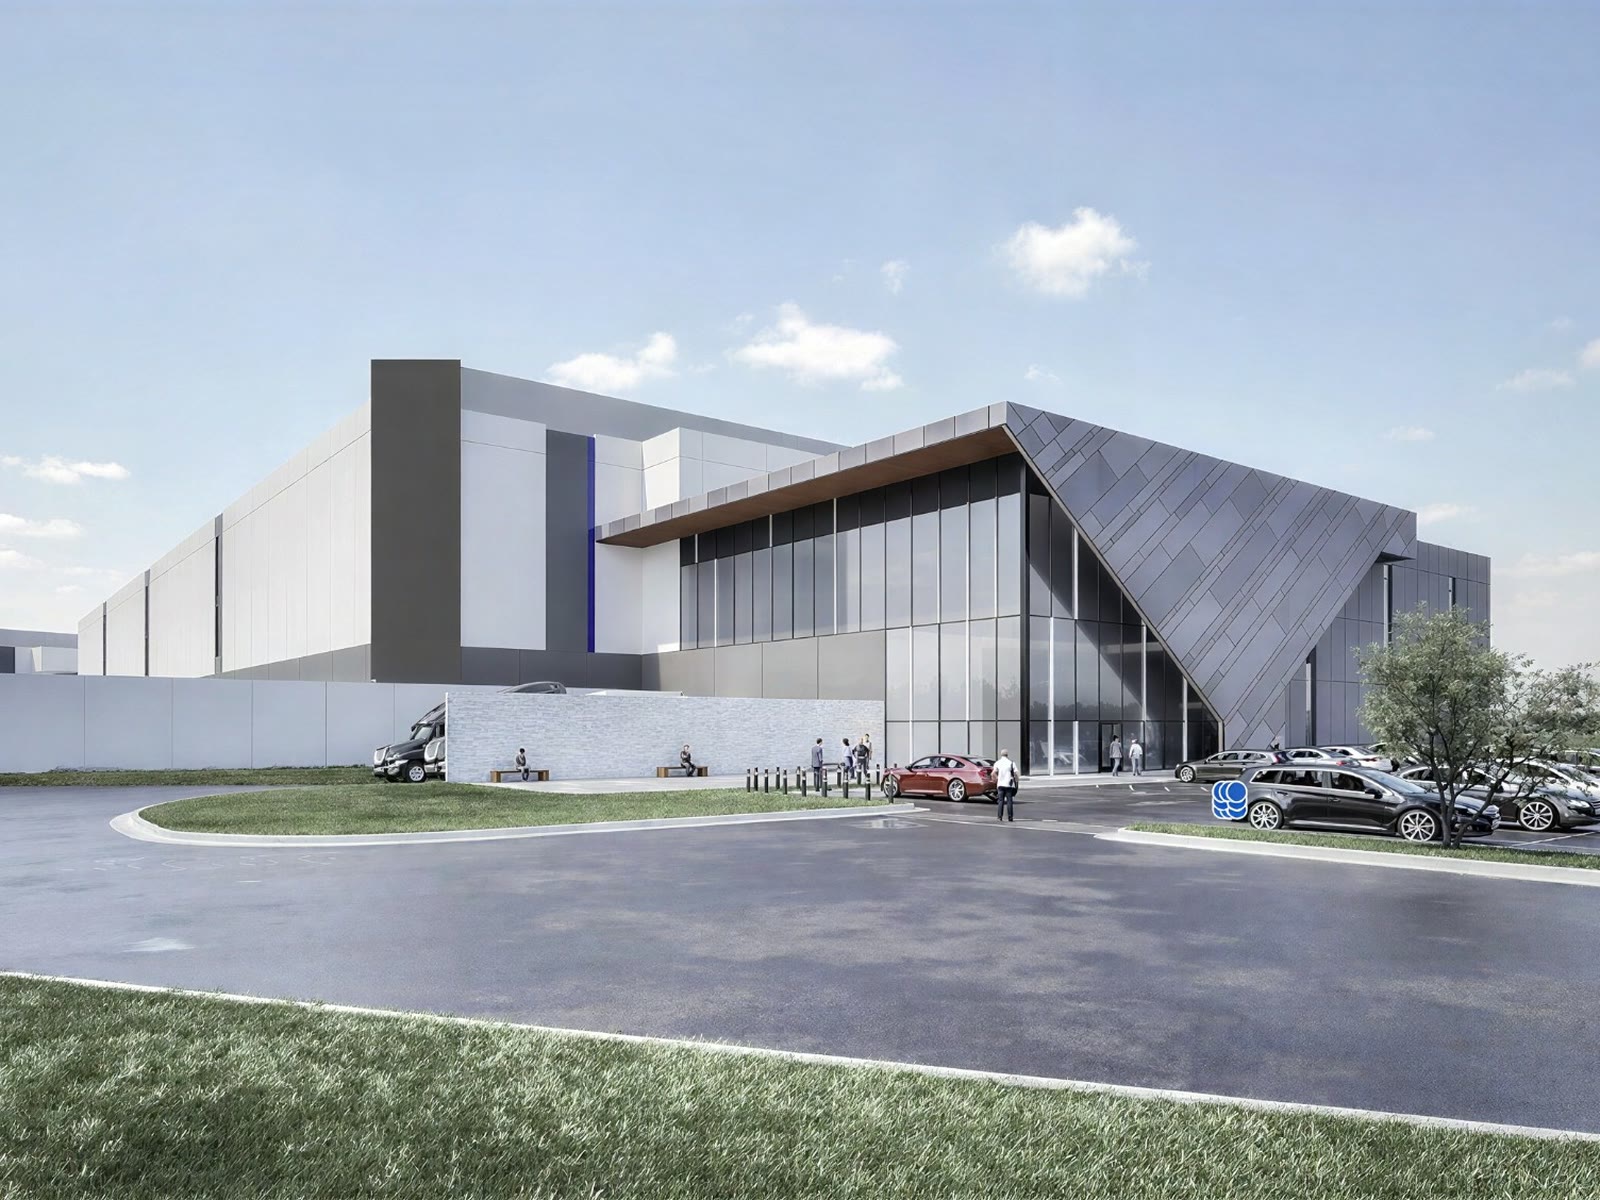
1.2 GW multi-building campus
Design-build · 612 acres · 4 × 297,805 sq ft
Site selection, a large-load utility grid interconnect, a systems and facilities impact study, and mission-critical power and cooling infrastructure design.
Contact
Tell us about your program.
Share the scale, the stage and where the numbers feel uncertain. A senior consultant will reply, not a sales sequence.